
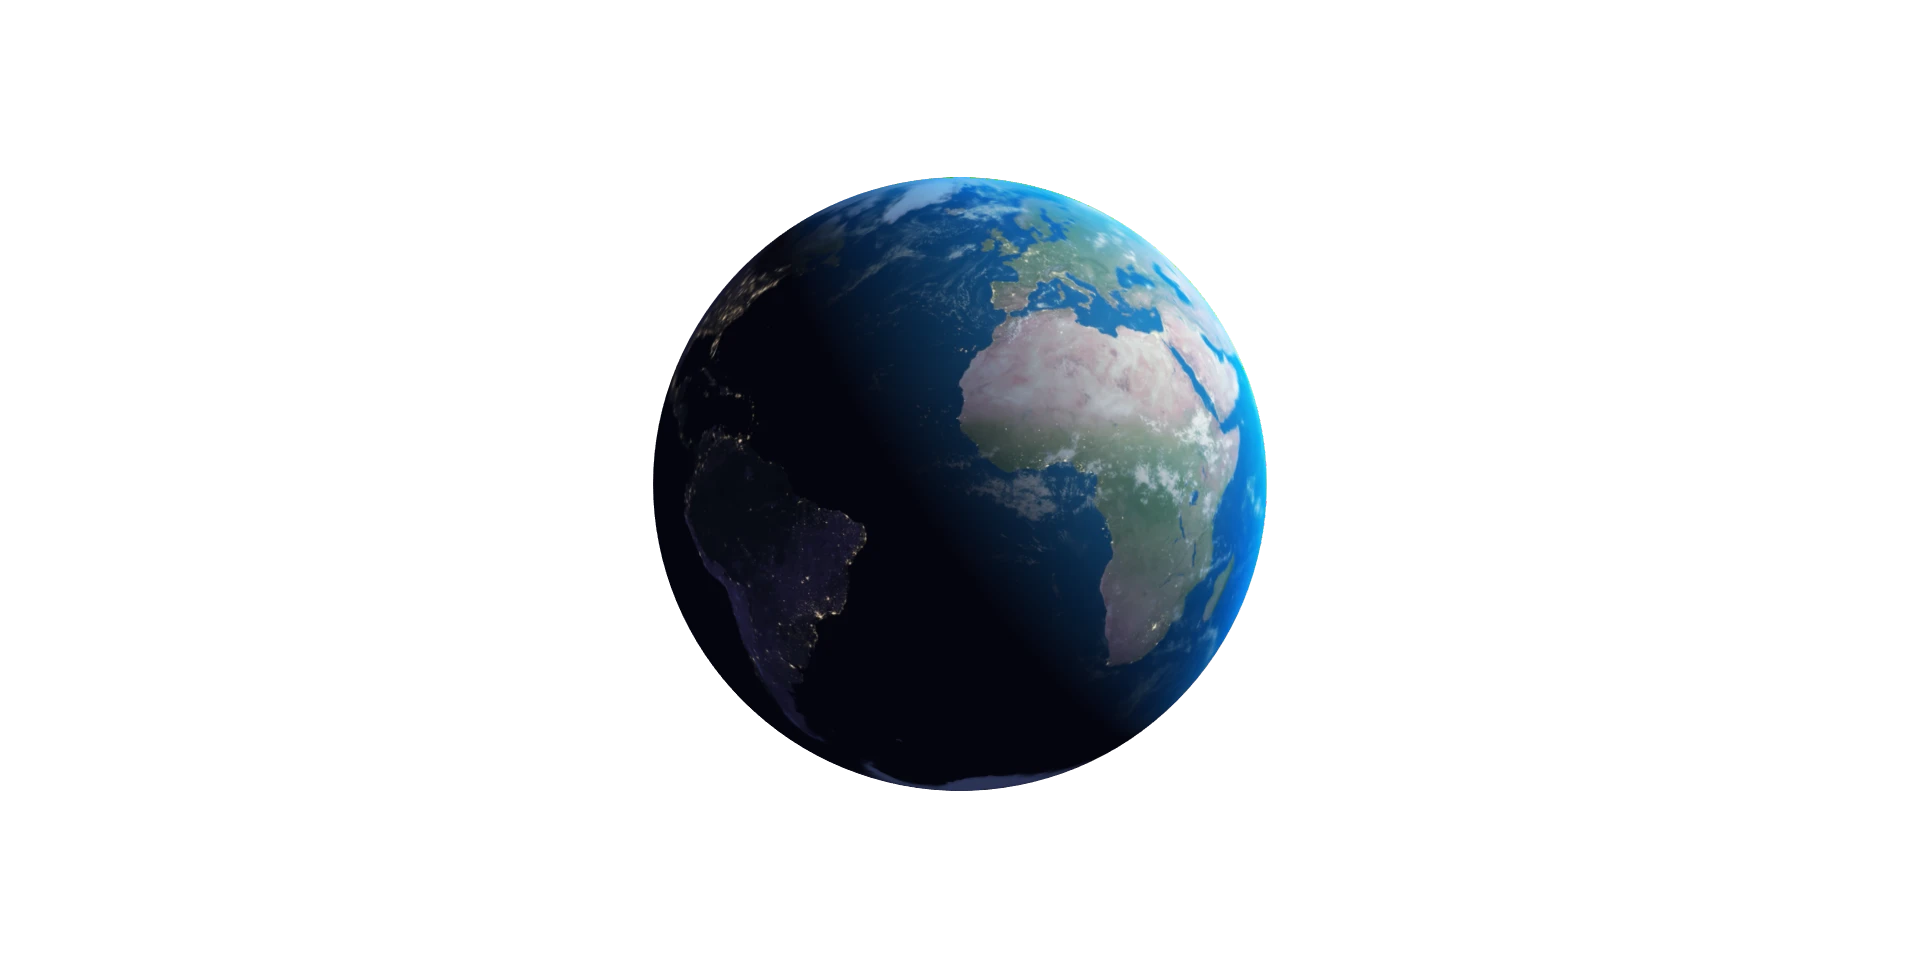
EARTH DATA,
LIGHTNING FAST
Turning complex Earth data into answers you can act on.
We turn decades of Earth data into actionable intelligence, at the speed your decisions demand.
We understand both the science and the engineering behind large-scale Earth data: how landscapes behave, and how to interrogate large amounts of information.
Our clients are government agencies, research institutions, industry bodies and private landholders, working across water, fire, forests, biodiversity and property. We are scientists, but our value is measured by what our clients achieve, not by what we publish.
You understand your problem; we understand the data. We work together to find the answers.
The data is not the problem.
The problem is what sits between the question and the answer: petabytes of imagery to store, align and validate before a single answer is reached. The complexity only grows when the next question arrives — which is why capable organisations end up with one-off studies and out-of-date maps.
Fragmented sources
Hundreds of missions and sensors, each with its own format, resolution and gaps to reconcile.
Heavy preparation
Cleaning, aligning and validating before a single question can be asked of the data.
Serious investment
Standing capability for storage, compute and specialists — before any of your data produces an answer.
Start again each time
Each new question repeats much of the work, so the effort invested never becomes a lasting capability.
Decisions made on old information — inefficiently, at higher cost, carrying more risk than necessary.
You do not need Earth observation.
You need the answers it contains.
We built the infrastructure — the archive, the workflows, the models — so that you don't have to. Bring us the question and we return an answer that is current, defensible and ready to use.
Ask in your own terms
Describe the place and the question: a property, a catchment, a season, a decade. Not the datasets, projections or processing steps behind it.
Delivered the way you work
A report for your executive, a live map for your team, or a feed into a system you already use. The answer arrives where the decision gets made.
Answers that stay current
Not a map with a date on it. As new observations arrive the answer updates, so what you relied on last quarter still holds this one.
Nothing to build
No cluster to provision, no specialists to recruit, no infrastructure to maintain. You pay for the answers, not the capacity to produce them.
Data to decision,
in one pass.
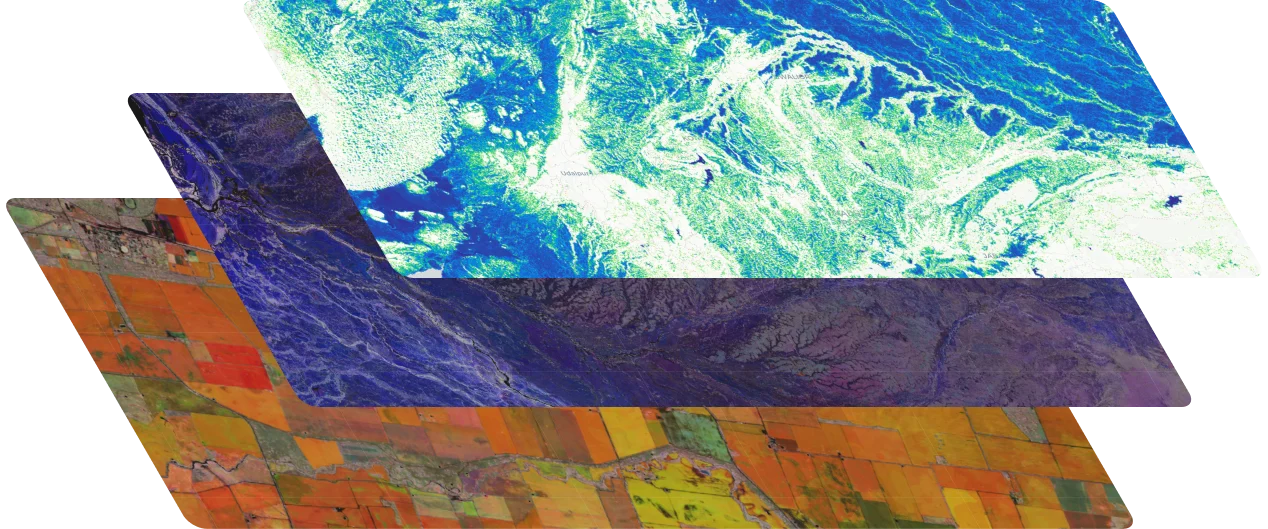
Observations, climate records, elevation and your own data enter one reconciled archive. The engine does the rest — and the answer lands where the decision gets made.
Capabilities built around your needs.
One archive, one engine, one team that understands both the data and the landscapes it describes.
Custom geospatial solutions
Your data, explored interactively — or our technology powering your branded product.
- +Tailored web applications
- +White-label deployments
- +Integration with existing systems
- +Scalable architecture
Data services
Streams blended across missions and models, cleaned and prepared for analysts, models and dashboards.
- +AI-driven data fusion
- +Analysis-ready imagery
- +150+ datasets, decades deep
- +One common interface
AI environmental intelligence
Insight into how landscapes behave, and early warning when they don't behave as expected.
- +Predictive analytics on archival data
- +Anomaly detection at pixel to catchment scale
- +Vegetation and change analysis
- +Risk intelligence
Reporting and compliance
Monitoring that runs on its own and evidence that stands up when it is questioned.
- +Automated reporting
- +Continuous compliance monitoring
- +Historical trend analysis
- +Defensible, traceable evidence
Know what is happening across more ground than anyone can cover.
Water authorities, land and resource agencies, agribusiness.
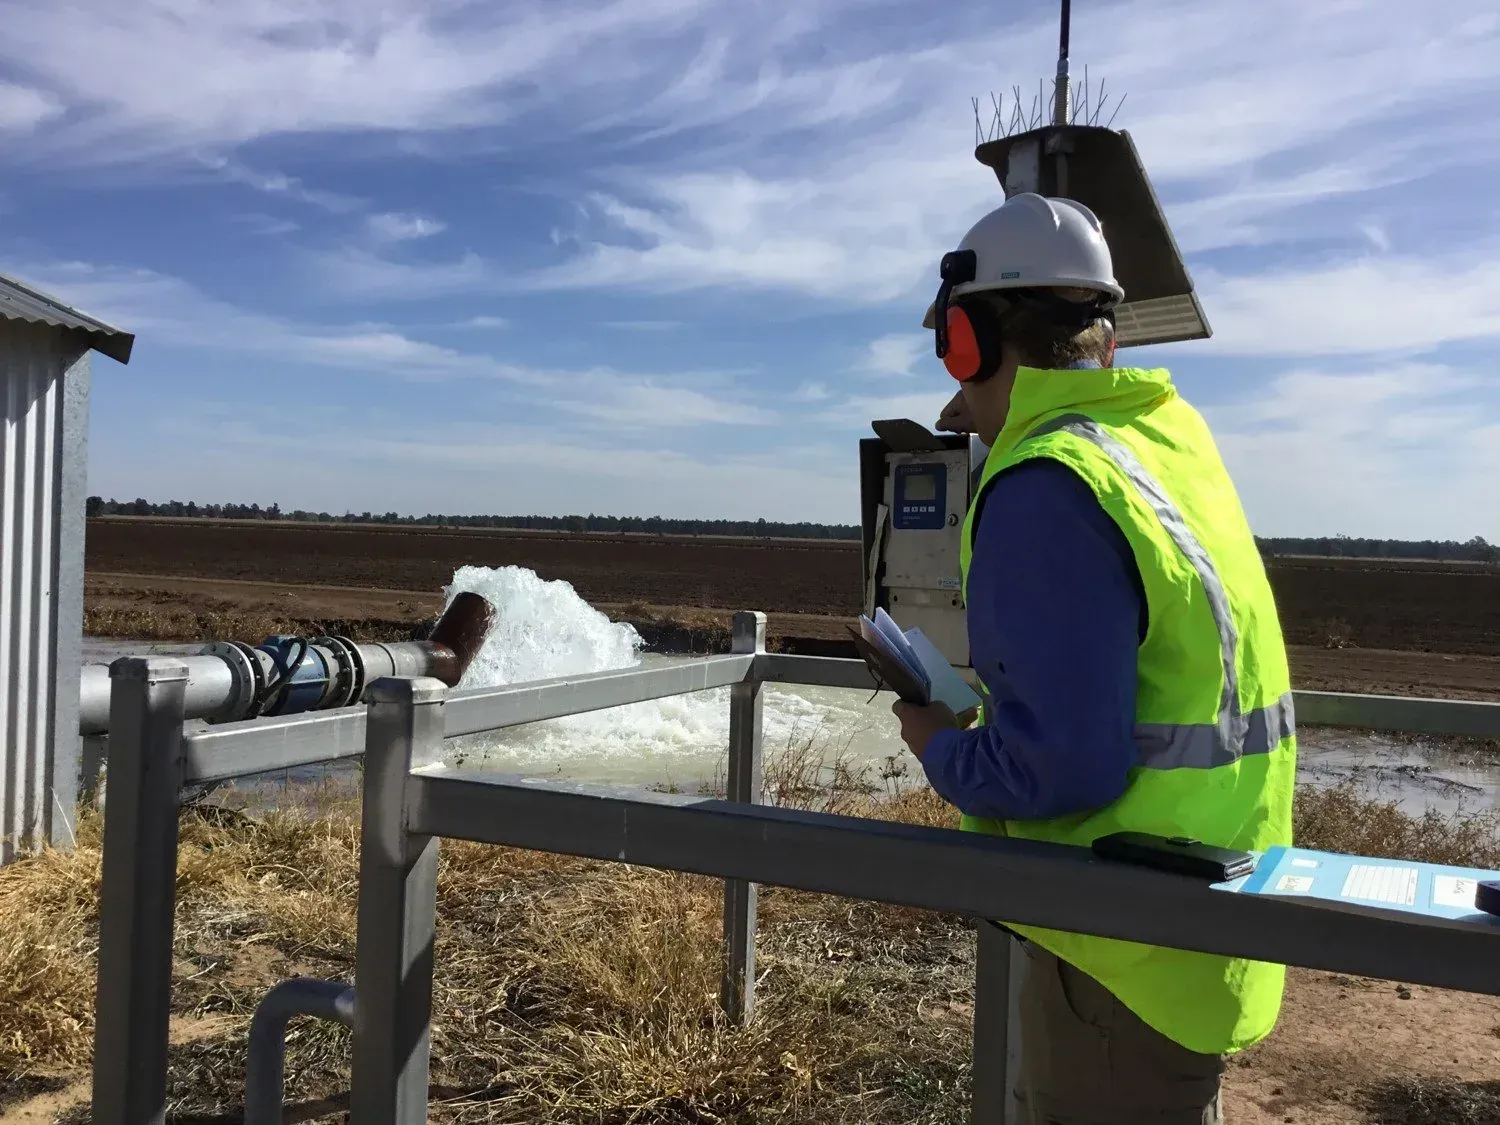
Monitoring use, compliance and productivity across areas too large to inspect on the ground.
- Licence and allocation compliance screening
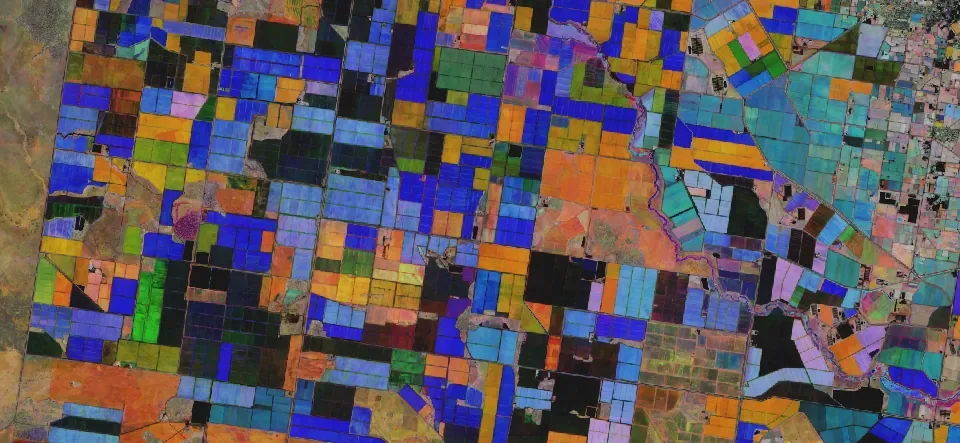
- Irrigated area and crop cycle mapping
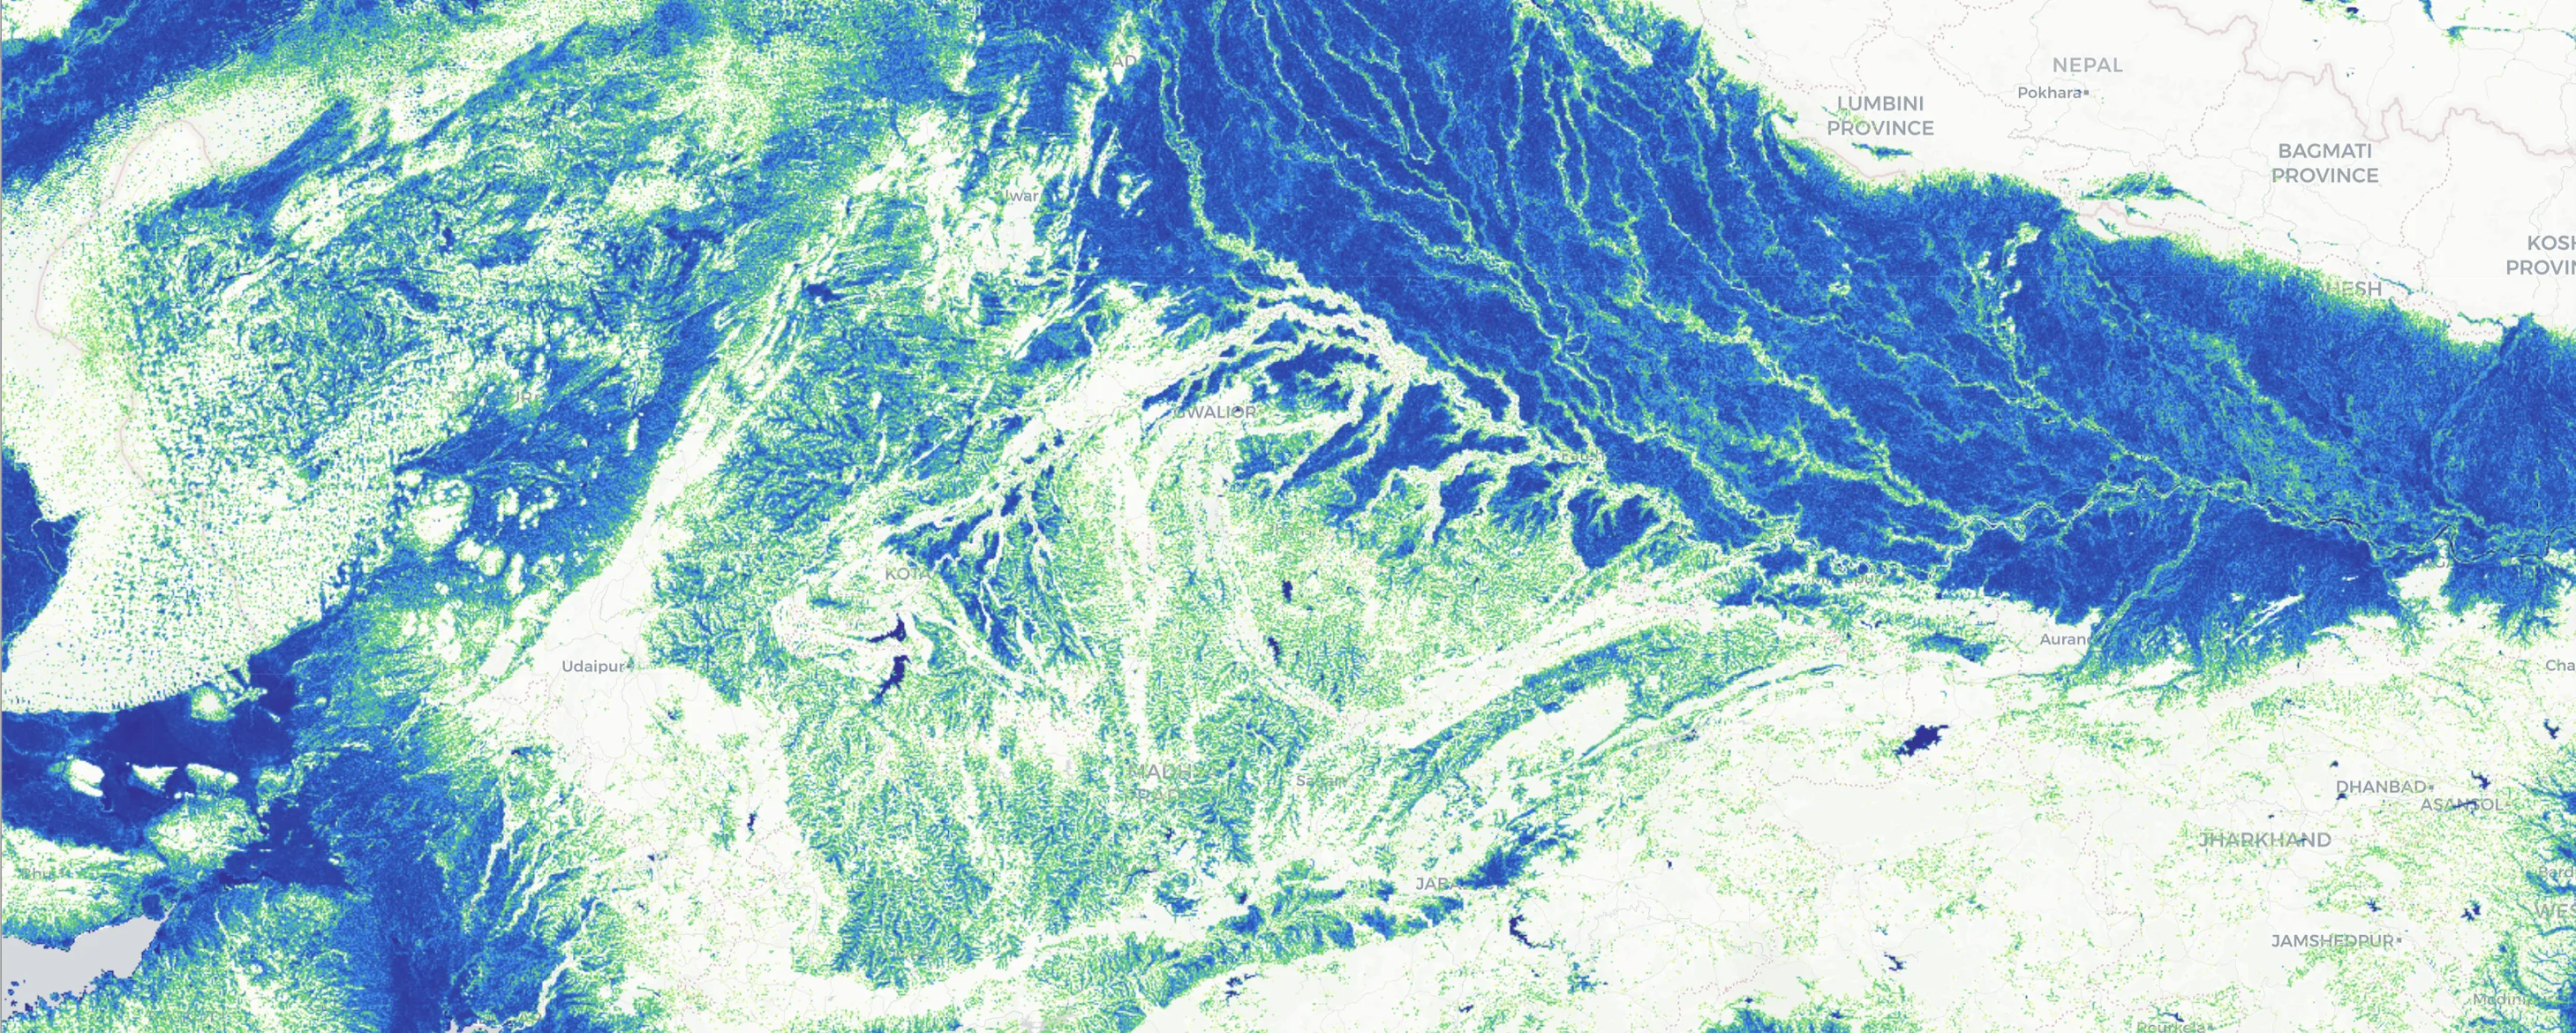
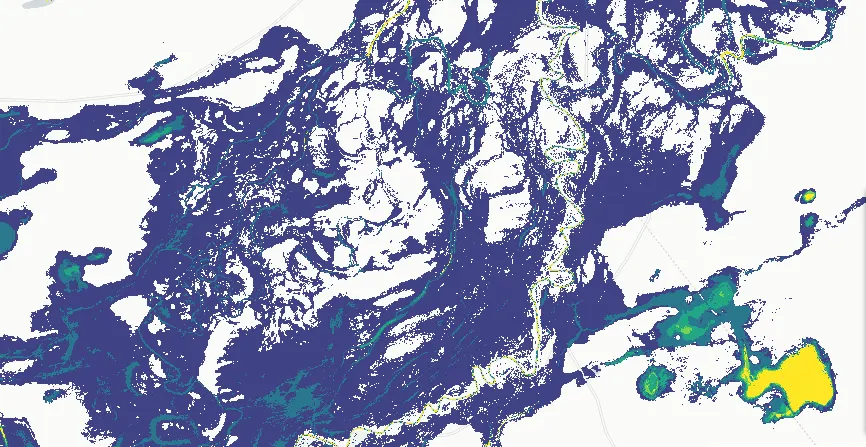
- Flood duration and water extent over time
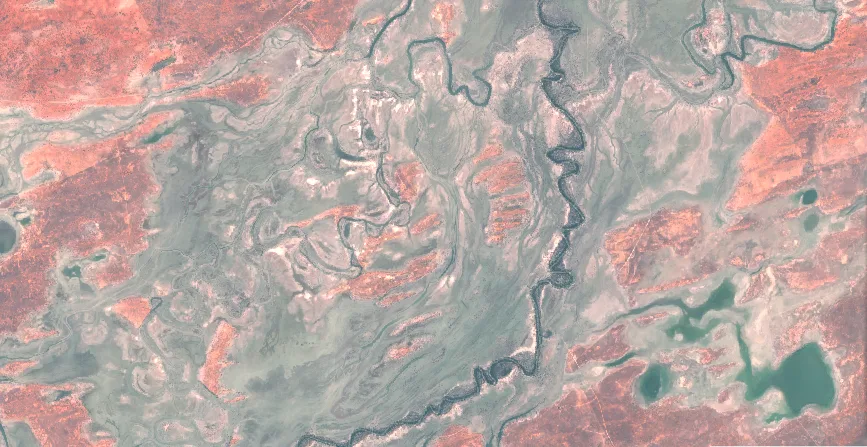
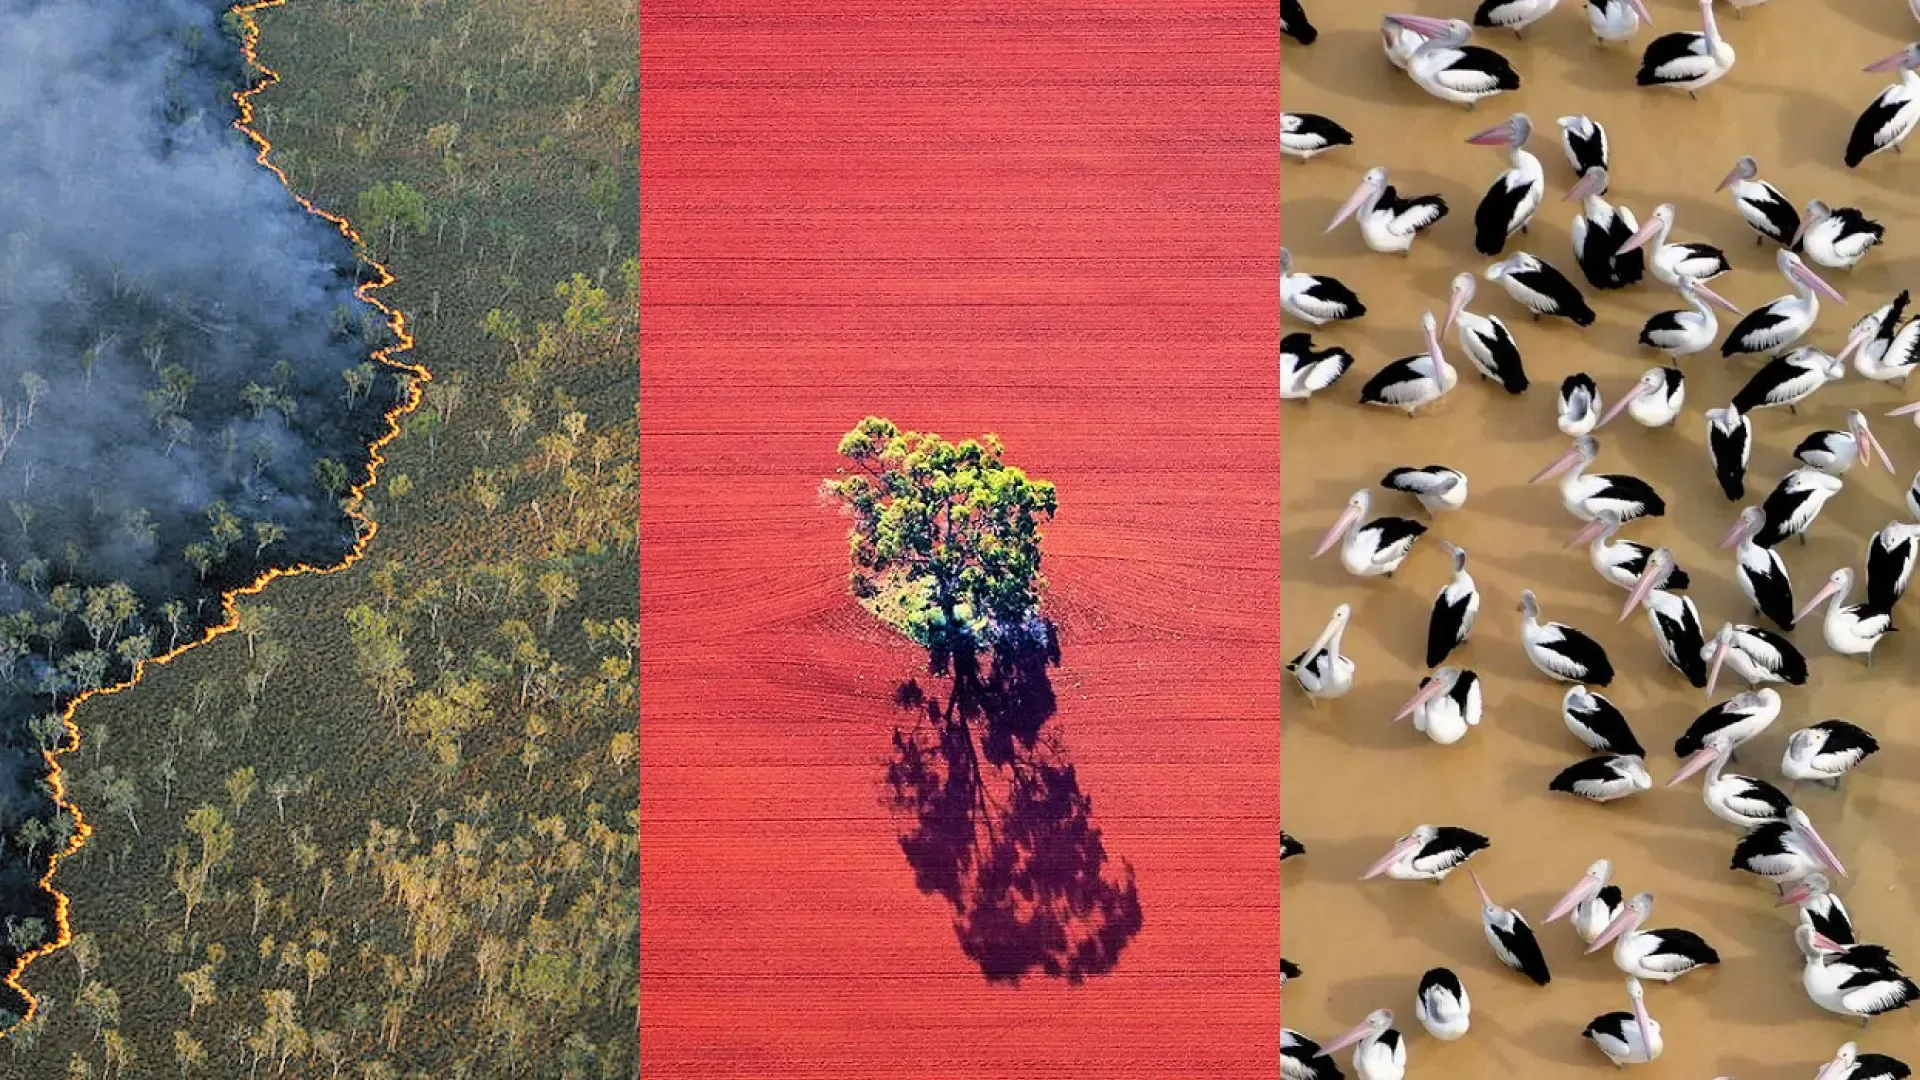
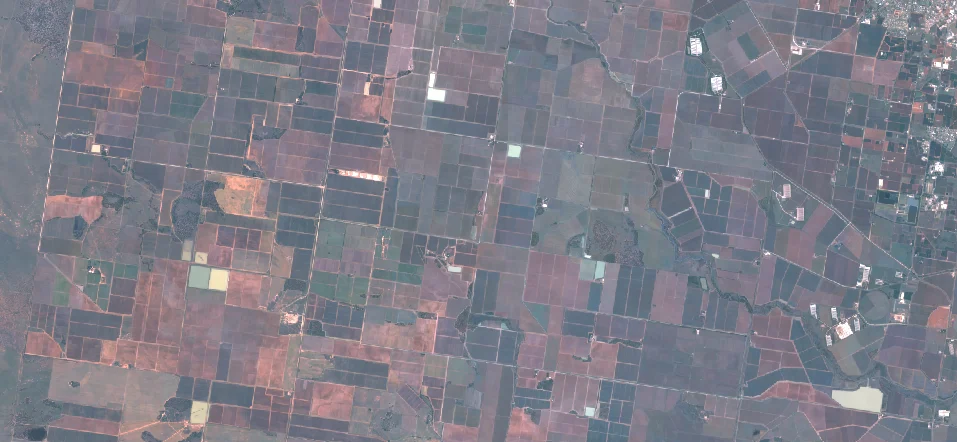
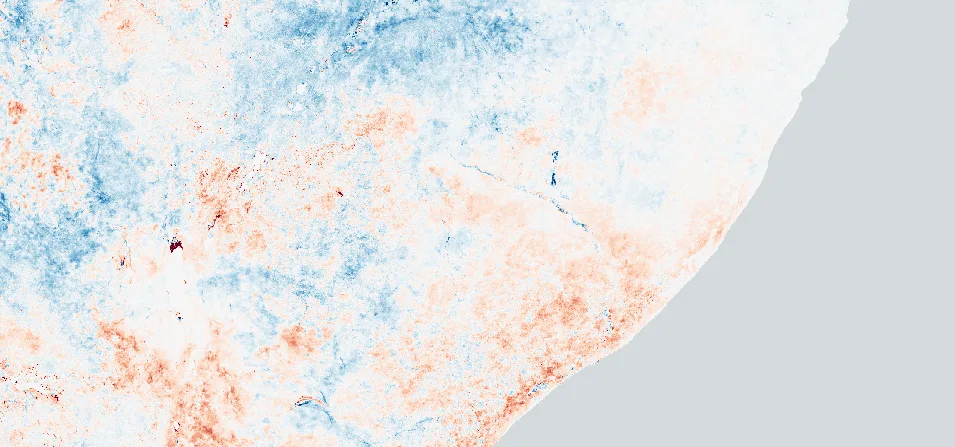
OBSERVATION 1987–2026
Sentinel-2 · Darling River
THE LIVING
ARCHIVE
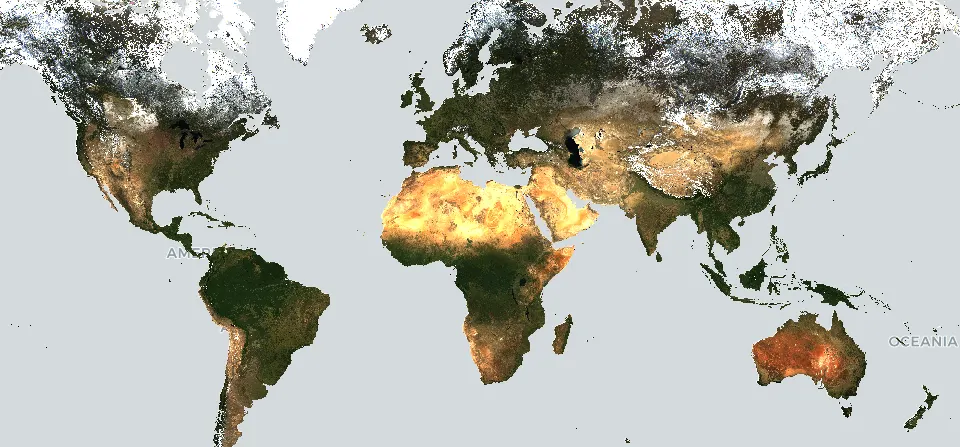
Hundreds of satellite, climate and elevation sources, reconciled by our scientists and engineers into one coherent archive: aligned, validated, ready to be analysed. Decades of history, current to the latest observation.
Terrak.io is the engine that brings the archive to life — one question, however large, answered in seconds and at full detail, delivered into the systems you already run.
One engine, every project.
Ask the questions you actually have
Combine datasets, define your own indices and thresholds. Over 150 datasets, yours to work with.
Bring your own data
Your cadastre, field records and proprietary layers, analysed alongside the archive.
Answers in the format you need
Map tiles, GeoTIFFs, JSON or spreadsheet summaries — whatever you expect.
As deep or as brief as you need
A single paddock over decades, or a continent reduced to one figure a board can decide on.
Our technology in action
Australia's Environment Report
A comprehensive annual summary of the state of Australia's land, natural resources and ecosystems — built with TERN and the Australian National University.
Of satellite observations behind every figure
Of spatial data, reconciled into one continental record
Readers and counting
What is the state of Australia's land, natural resources and ecosystems this year, and what has changed?
Reporting on a country's environment once meant booking time on a national supercomputer and running batch jobs — expensive, slow, rigid and hard to repeat.
Decades of satellite observations and more than 20 TB of spatial data, reconciled into one continental record.
Working with Australia's Terrestrial Ecosystem Research Network (TERN) and the ANU, we built the data infrastructure behind the Report.
Continental-scale analyses now run interactively and can be rerun or extended as new data arrives — no supercomputer booking required.
An accessible annual account of the nation's land and ecosystems for researchers, land managers and the public.
Vegetation Monitoring & Assessment Program (VMAP)
A collaboration with the Australian National University, tracking changes in Australia's forests and vegetation to inform carbon emissions and removals monitoring.
An annually updated, AI-driven forest and vegetation map dating back to 2020. The model is trained on airborne LiDAR and runs over the full Sentinel-2 archive via Terrak.io — a living record of change rather than a snapshot, at a fraction of the cost of commissioning a new map each year.
Nature Repair Market (PlanR)
A national framework rewarding landholders and investors for measurable improvements to Australia's biodiversity.
Terrak.io generates carbon and biodiversity assessments for any property in Australia — on demand, nationwide and at no cost to landholders. What would otherwise need a bespoke ecological assessment per property becomes a scalable operational capability.
YOU KNOW,
RATHER THAN
ASSUME.
Current information. Evidence behind it. Available when the question comes up.
Risk management
Detect change early enough to act on it, rather than reporting it afterwards.
Compliance
Monitor continuously and demonstrate compliance, without putting anyone on the ground.
Due diligence
Support a valuation, a claim or an investment case with spatial evidence.
Operations
Replace manual analysis and automate reporting with something that runs on its own.
When a question is easy to ask, the first answer is rarely the last. A finding on one property prompts the same look at forty others. The value turns up in places nobody planned for.
Science you can check, in answers you can defend.
Our data is used in compliance cases, valuations and public reports. The confidence you place in them is backed by science.
Research, made operational
The methods behind our answers come from published, peer-reviewed science. We add the engineering that turns a paper into a continental-scale product.
Measured against reality
Stream gauges, flux towers, field sensors, airborne LiDAR. Results are validated against physical measurements, not modelled estimates.
Uncertainty stated
Every satellite and climate model carries uncertainty. Our outputs make that uncertainty transparent, so you know how far to trust a result.
Traceable to source
Missions, dates and methods travel with every answer, so any figure can be traced back to the record behind it.
Haizea grew from two decades of environmental research and continental-scale monitoring at the Australian National University. The people who understand how landscapes behave work beside the people who know how to interrogate enormous amounts of data.
Dr Pablo Rozas Larraondo
An artificial intelligence scientist specialising in large-scale geospatial systems. His work in AI, spatial data and large-scale computing shaped the technology behind Terrak.io and continues to guide its development.
Professor Albert Van Dijk
Professor of Water Science and Management at the ANU's Fenner School of Environment and Society, where he established the Centre for Water and Landscape Dynamics. Two decades of continental-scale environmental research underpin much of the science behind Haizea.
It all starts with a conversation.
BRING US
ONE
QUESTION.
Something worth knowing, understanding or changing. We'll show you what the data can reveal.
Canberra ACT 2600 · contact@haizea.com.au
ABN 27 648 451 969 · Founded 2021